|
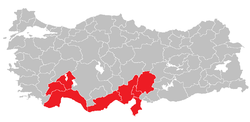
Mediterranean Region (statistical)
Region in Turkey Mediterranean Region
Akdeniz Bölgesi |
|---|
|
 | | Country | Turkey |
|---|
|
• Region | 89,983 km2 (34,743 sq mi) |
|---|
|
• Region | 10,851,089 [1] |
|---|
| • Rank | 3rd |
|---|
| • Urban | 10,527,337 |
|---|
| • Rural | 323,752 |
|---|
| HDI (2022) | 0.844[2]
very high · 6th |
|---|
The Mediterranean Region (Turkish: Akdeniz Bölgesi) (TR6) is a statistical region in Turkey.
Subregions and provinces
Age groups
As of December 31, 2014[3]
| Age groups
|
Total
|
Male
|
Female
|
| 0 – 4
|
835,926
|
430,092
|
405,834
|
| 5 – 9
|
857,049
|
440,226
|
416,823
|
| 10 – 14
|
830,907
|
426,406
|
404,501
|
| 15 – 19
|
839,153
|
433,393
|
405,760
|
| 20 – 24
|
734,359
|
367,807
|
366,552
|
| 25 – 29
|
755,932
|
377,829
|
378,103
|
| 30 – 34
|
813,129
|
408,719
|
404,410
|
| 35 – 39
|
763,167
|
384,548
|
378,619
|
| 40 – 44
|
722,840
|
361,073
|
361,767
|
| 45 – 49
|
612,121
|
310,586
|
301,535
|
| 50 – 54
|
578,232
|
290,277
|
287,955
|
| 55 – 59
|
466,250
|
234,388
|
231,862
|
| 60 – 64
|
364,034
|
179,783
|
184,251
|
| 65 – 69
|
272,392
|
129,362
|
143,030
|
| 70 – 74
|
181,051
|
83,157
|
97,894
|
| 75 – 79
|
130,040
|
56,971
|
73,069
|
| 80 – 84
|
96,509
|
42,405
|
54,104
|
| 85 – 89
|
40,463
|
14,437
|
26,026
|
| 90+
|
13,217
|
3,596
|
9,621
|
| Total
|
9,906,771
|
4,975,055
|
4,931,716
|
Internal immigration
Between December 31, 2013 and December 31, 2014[4]
| Region
|
Population
|
Immigrants
|
Emigrants
|
Net immigrants
|
Net immigration rate
|
| Mediterranean
|
9,906,771
|
226,062
|
222,621
|
3,441
|
0.35
|
State register location of Mediterranean residents
As of December 31, 2014[5]
| Region
|
Population
|
Percentage
|
| Istanbul
|
38,673
|
0.4
|
| West Marmara
|
27,376
|
0.3
|
| Aegean
|
166,785
|
1.7
|
| East Marmara
|
61,782
|
0.6
|
| West Anatolia
|
192,934
|
2.0
|
| Mediterranean
|
7,329,964
|
74.6
|
| Central Anatolia
|
305,343
|
3.1
|
| West Black Sea
|
133,053
|
1.4
|
| East Black Sea
|
70,823
|
0.7
|
| Northeast Anatolia
|
101,600
|
1.0
|
| Central East Anatolia
|
393,102
|
4.0
|
| Southeast Anatolia
|
1,002,771
|
10.2
|
| Total
|
9,824,206
|
100
|
Marital status of 15+ population by gender
As of December 31, 2014[6]
| Gender
|
Never married
|
%
|
Married
|
%
|
Divorced
|
%
|
Spouse died
|
%
|
Total
|
| Male
|
1,122,023
|
30.8
|
2,364,194
|
64.8
|
112,711
|
3.1
|
48,772
|
1.3
|
3,647,700
|
| Female
|
827,743
|
22.6
|
2,365,564
|
64.6
|
158,683
|
4.3
|
311,787
|
8.5
|
3,663,777
|
| Total
|
1,949,766
|
26.7
|
4,729,758
|
64.7
|
271,394
|
3.7
|
360,559
|
4.9
|
7,311,477
|
Education status of 15+ population by gender
As of December 31, 2014[7]
| Gender
|
Illiterate
|
%
|
Literate with no diploma
|
%
|
Primary school
|
%
|
Primary education
|
%
|
Middle school
|
%
|
High school
|
%
|
College or university
|
%
|
Master's degree
|
%
|
Doctorate
|
%
|
Unknown
|
%
|
Total
|
| Male
|
49,828
|
1.4
|
139,011
|
3.8
|
846,202
|
23.2
|
762,322
|
20.9
|
369,063
|
10.1
|
889,689
|
24.4
|
493,083
|
13.5
|
28,688
|
0.8
|
8,057
|
0.2
|
61,757
|
1.7
|
3,647,700
|
| Female
|
232,853
|
6.4
|
344,216
|
9.4
|
1,082,605
|
29.5
|
591,587
|
16.1
|
266,968
|
7.3
|
672,995
|
18.4
|
391,200
|
10.7
|
18,800
|
0.5
|
5,071
|
0.1
|
57,482
|
1.6
|
3,663,777
|
| All genders
|
282,681
|
3.9
|
483,227
|
6.6
|
1,928,807
|
26.4
|
1,353,909
|
18.5
|
636,031
|
8.7
|
1,562,684
|
21.4
|
884,283
|
12.1
|
47,488
|
0.6
|
13,128
|
0.2
|
119,239
|
1.6
|
7,311,477
|
See also
References
External links
Sources
|
|