|
Results of the 2013 Australian federal election in Queensland
2013 Australian federal election
(Queensland)|
|
|
|
|
First party
|
Second party
|
|
|

|

|
| Leader
|
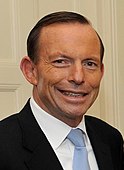
Tony Abbott
|
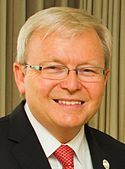
Kevin Rudd
|
| Party
|
Coalition
|
Labor
|
| Last election
|
21 seats
|
8 seats
|
| Seats before
|
21
|
8
|
| Seats won
|
22
|
6
|
| Seat change
|
 1 1
|
 2 2
|
| Popular vote
|
1,152,217
|
751,230
|
| Percentage
|
45.66%
|
29.77%
|
| Swing
|
 1.76 1.76
|
 3.81 3.81
|
| TPP
|
56.98%
|
43.02%
|
| TPP swing
|
 1.84 1.84
|
 1.84 1.84
|
|
|
|
Third party
|
Fourth party
|
|
|

|

|
| Leader
|
Clive Palmer
|
Bob Katter
|
| Party
|
Palmer United
|
Katter's Australian
|
| Last election
|
—
|
—
|
| Seats before
|
0
|
1
|
| Seats won
|
1
|
1
|
| Seat change
|
 1 1
|

|
| Popular vote
|
278,125
|
94,540
|
| Percentage
|
11.02%
|
3.75%
|
| Swing
|
 11.02 11.02
|
 2.15 2.15
|
|
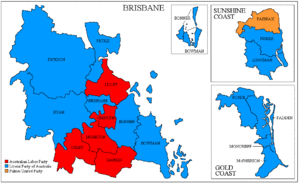
![]() Winning Party by Electorate
Winning Party by Electorate  First Preference Vote
  Two-Candidate Preferred Vote
 |
This is a list of electoral division results for the Australian 2013 federal election in the state of Queensland.[1]
 Electoral divisions: Queensland Electoral divisions: Queensland
 Electoral divisions: Brisbane, Sunshine Coast and Gold Coast areas Electoral divisions: Brisbane, Sunshine Coast and Gold Coast areas
Overall result
| Party
|
Votes
|
%
|
Swing
|
Seats
|
Change
|
|
|
Liberal National Party
|
1,152,217
|
45.66
|
–1.76
|
22
|
 1 1
|
|
|
Australian Labor Party
|
751,230
|
29.77
|
–3.81
|
6
|
 2 2
|
|
|
Palmer United Party
|
278,125
|
11.02
|
+11.02
|
1
|
 1 1
|
|
|
Australian Greens
|
156,884
|
6.22
|
–4.70
|
|
|
|
|
Katter's Australian Party
|
94,540
|
3.75
|
+2.15
|
1
|
 1 1
|
|
|
Family First Party
|
51,375
|
2.04
|
–1.85
|
|
|
|
|
Rise Up Australia Party
|
9,889
|
0.39
|
+0.39
|
|
|
|
|
Australian Sex Party
|
2,859
|
0.11
|
+0.11
|
|
|
|
|
One Nation
|
2,529
|
0.10
|
−0.06
|
|
|
|
|
Citizens Electoral Council
|
2,292
|
0.09
|
+0.03
|
|
|
|
|
Australian Independents
|
1,901
|
0.08
|
+0.08
|
|
|
|
|
Secular Party of Australia
|
1,808
|
0.07
|
+0.05
|
|
|
|
|
Australian Voice Party
|
1,136
|
0.05
|
+0.05
|
|
|
|
|
Democratic Labour Party
|
1,075
|
0.04
|
−0.15
|
|
|
|
|
Australian Stable Population Party
|
729
|
0.03
|
+0.03
|
|
|
|
|
Future Party
|
481
|
0.02
|
+0.02
|
|
|
|
|
Uniting Australia Party
|
386
|
0.02
|
+0.02
|
|
|
|
|
Socialist Alliance
|
377
|
0.01
|
−0.02
|
|
|
|
|
Independents
|
10,435
|
0.41
|
−1.48
|
0
|
 1 1
|
|
|
Non Affiliated
|
2,984
|
0.12
|
+0.09
|
|
|
| Total
|
2,523,252
|
|
|
30
|
|
| Two-party-preferred vote
|
|
|
Liberal National Party
|
1,437,803
|
56.98
|
+1.84
|
22
|
 1 1
|
|
|
Australian Labor Party
|
1,085,449
|
43.02
|
–1.84
|
6
|
 2 2
|
Results by division
Blair
Bonner
Bowman
Brisbane
Capricornia
Dawson
Dickson
Fadden
Fairfax
Fisher
Flynn
Forde
Griffith
Groom
Herbert
Hinkler
Kennedy
Leichhardt
Lilley
Longman
Maranoa
McPherson
Moncrieff
Moreton
Oxley
Petrie
Rankin
Ryan
Wide Bay
Wright
References
- ^ "2013 Federal Election Results for Queensland by Division". AEC.
- ^ 2013 results for Blair, AEC.
- ^ 2013 results for Bonner, AEC.
- ^ 2013 results for Bowman, AEC.
- ^ 2013 results for Brisbane, AEC.
- ^ 2013 results for Capricornia, AEC.
- ^ 2013 results for Dawson, AEC.
- ^ 2013 results for Dickson, AEC.
- ^ 2013 results for Fadden, AEC.
- ^ 2013 results for Fairfax, AEC.
- ^ 2013 results for Fisher, AEC.
- ^ 2013 results for Flynn, AEC.
- ^ 2013 results for Forde, AEC.
- ^ 2013 results for Griffith, AEC.
- ^ 2013 results for Groom, AEC.
- ^ 2013 results for Herbert, AEC.
- ^ 2013 results for Hinkler, AEC.
- ^ 2013 results for Kennedy, AEC.
- ^ 2013 results for Leichhardt, AEC.
- ^ 2013 results for Lilley, AEC.
- ^ 2013 results for Longman, AEC.
- ^ 2013 results for Maranoa, AEC.
- ^ 2013 results for McPherson, AEC.
- ^ 2013 results for Moncrieff, AEC.
- ^ 2013 results for Moreton, AEC.
- ^ 2013 results for Oxley, AEC.
- ^ 2013 results for Petrie, AEC.
- ^ 2013 results for Rankin, AEC.
- ^ 2013 results for Ryan, AEC.
- ^ 2013 results for Wide Bay, AEC.
- ^ 2013 results for Wright, AEC.
See also
|
|